


Introduction
Statistics is a valuable tool that allows us to understand and make sense of the vast amounts of data around us. Recently, I took a course on statistics by Maggie Matsui using Datacamp and Python to explore this field. I'm excited to share my recent statistics journey with you! Writing this blog has made me realize how much I've learned about handling data through a course on Datacamp, where Python became my trusty companion. The blog won't be just about technical stuff – I'll be showing you some Python code and cool visualizations.
Expect to read about the challenges I faced (and overcame!), those "aha" moments, and the pure joy of finding interesting things in the data. This blog is my way of saying, "Hey, look at what statistics and Python can do together!" It's not just about numbers; it's about solving puzzles and making sense of the world.
Understanding Statistics
At its core, statistics involves collecting and analyzing data. It provides a way for us to examine information, draw conclusions, and make decisions based on our findings.
The Importance of Summary Statistics
Summary statistics play a crucial role in statistics by offering key information about a dataset. They provide a quick overview that makes the data more accessible and understandable.
How Python Helps in Statistics
Python, as a versatile programming language, proves highly useful in statistical analysis. Here are some ways Python can be beneficial to real-world statistics:
- Predicting Purchases: Python can analyze buying patterns to predict the likelihood of someone purchasing a product.
- Optimizing Occupancy: In businesses like hotels, Python can predict and optimize occupancy based on numerical data.
- Manufacturing Optimization: Python can assist in determining the quantity of different-sized products to meet the needs of a diverse consumer base.
- A/B Testing: In marketing, Python can compare the effectiveness of different ads through A/B testing.
Limitations of Statistics
While powerful, statistics cannot answer every question. For instance, it cannot explain why a particular TV show became super popular. Some phenomena are beyond the scope of statistical analysis.
Types of Statistics
Descriptive Statistics
Describes and summarizes data, providing insights into its characteristics. For example, knowing that 50% of people drive to work is a descriptive statistic

Inferential Statistics
This goes beyond describing data and involves using a sample to make predictions about a larger population.

Measures of Center
- Mean, Median, Mode: These measures help us understand the central tendencies of the data. In Python, calculating them is straightforward.
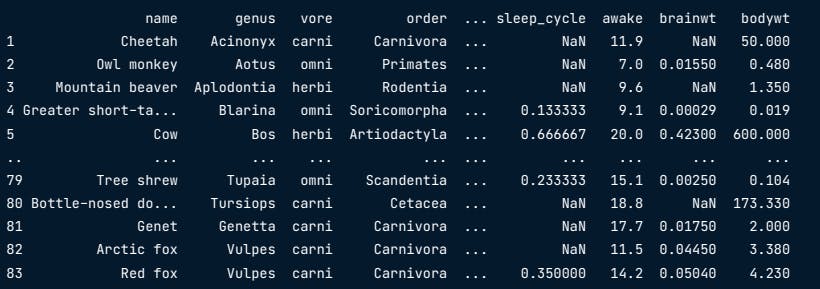
Practical Application: Mammal Sleep Data
To illustrate how these measures work, let's explore a dataset on mammal sleep patterns using Python's popular library numpy.
How long do mammals in this dataset typically sleep?
import numpy as np
np.mean(msleep['sleep_total'])
Calculating the mean is quite easy using
$$np.mean()$$
Output:

while median is calculated using
$$np.median()$$
msleep['sleep_total'].sort_values()
np.median(msleep['sleep_total'])
Output:

The mode, as a statistical measure, is particularly valuable when dealing with categorical data, as it identifies the value with the highest frequency. In Python, the statistics library proves to be a useful tool for calculating the mode, especially when working with categorical outputs.
import statistics
msleep['vore'].value_counts()
statistics.mode(msleep['vore'])
Measures of spread
What is Spread?
Spread in statistics refers to the extent to which data points in a dataset deviate from the mean. It provides insights into the variability or dispersion of the data.

**Variance
**Variance is a measure of the average distance of each data point from the mean. The calculation involves the following steps:
Subtract mean from each data point
dists = msleep['sleep_ total'] - np.mean(msleep['sleep_ total'])Squaring each distance
sq_ dists = dists ** 2Sum squared distances
sum sq dists = np.sum(sq_ dists)Divide by number of data points - 1
variance = sum sq dists / (83 - 1)print(variance)
Output:

However, there is a much easier way to calculate variance using
$$np.var()$$
np.var(msleep['sleep_ total'], ddof=1)
Output:

For population variance ddof is not used
np.var(msleep['sleep_total'])
Output:

Standard Deviation
Standard deviation is the square root of the variance and represents the average deviation of data points from the mean. It can be calculated using:
$$np.std()$$
np.std(msleep['sleep_ total'], ddof=1)

Quantiles
Quantiles represent points in a dataset that are divided into equal portions. Key quantiles include the median (0.5 quantile) and quartiles (0, 0.25, 0.5, 0.75, 1). They can be calculated using:
np.quantile(msleep['sleep_ total'], [0, 0.25, 0.5, 0.75, 1])

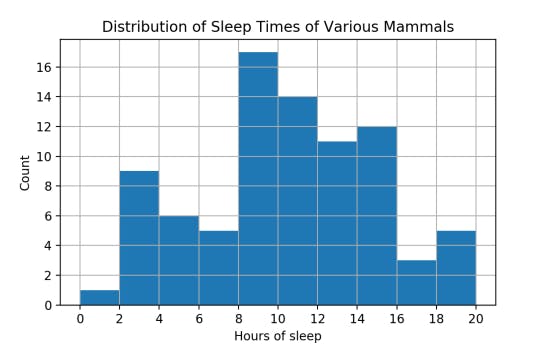
Boxplot

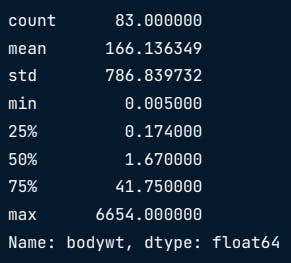
Boxplots visually represent quartiles, and the Interquartile Range (IQR) is the height of the box. You can also describe all the information with describe()
Conclusion
So, that's my statistics journey with Python till now. Learning stats through Datacamp and Python has been eye-opening. It's not just about numbers; it's like solving puzzles and making sense of the world.
We covered the basics like mean, median, and mode, and explored a dataset on mammal sleep using Python. It's fascinating how Python effortlessly handles the math.
In a nutshell, stats and Python make a dynamic duo, decoding the complexities of our data-filled world. Stay tuned for more adventures in the world of statistics and Python! There's still a lot more to discover, like digging into advanced analytics and solving real-world issues. Come along on this journey with me as we explore more about numbers and insights. Stay tuned for the next blog post—I promise it'll be interesting!